At every stage of the evidence gathering process, being able to plan-ahead means it becomes possible to make precise decisions about our evidence usage. Then, we will be more likely to only gather relevant, useable and required evidence and ensure our tools are ideal for our needs. Remember, we only want to gather information if it tells us something about where we are on our journey. If evidence doesn’t help us with our navigation then it is doubtful we should be spending our precious, limited resources, on its collection. As noted in their recent report, Amaze (2018, p.30) confirm the importance of quality data acquisition:
We have previously discussed the types of information we hope to collect. We differentiated between primary and secondary information based on its source. Secondary data involves gathering information which has been already compiled previously in some way. For example, if a peer program objective is responsible budgetary management, a selected indicator may be a variance (i.e. the difference between budgeted spending and actual spending). This information is likely already calculated for Board or Finance Committee meetings and reporting. If we use this variance data to assess this objective then we are using secondary data for this evaluation. Secondary evidence may be numerical or in the form of quotes from reports or emails, or comments in a reflection journal. Primary data is relevant information that comes from the project using purposeful observations and measurements collected (such as from a survey).
Evidence will form the basis of each thorough investigation of where your peer program is currently located and may involve the collection of qualitative and/or quantitative primary information. Quantitative information is collected through measurement and is able to be processed using computational, statistical or other techniques. This contrasts with qualitative information with is gathered using observation or subjective judgment and does not involve measurement (at least immediately). Qualitative information may be processed or quantified where appropriate or it may be presented through images or as text (such as quotes by Members, or feedback from Funders). The type of information collected should be determined by the objective itself and the indicator selected. The following table provides an excellent overview of the core differences between qualitative and quantitative information in relation to its aim, characteristics, data collection methods and data analysis focus (Save the Children booklet, 2017, p.10). In the context of this resource for peer disability support, when it comes to gathering information from primary sources, we have been focussing on key collection methods including the popular tool of ‘surveys’.
SELF STUDY Q6.1
Refer to the tables you developed in Questions 5.8, 5.9, 5.10 and 5.11.
What types of evidence gathering tools are you planning to use in your planned evaluation?
If this includes a survey, what types of questions can you ask?
What sort of information will you collect from each of the different types of questions you will ask?
You can ask numerous kinds of questions in a survey; this results in a variety of information. Questions within the survey can be: closed, open-ended, scaled or multiple-choice. As discussed in earlier sections of this training package, each provides us with very distinctive evidence. Therefore, the way we analyse the responses to each are different.

As noted already, how you employ your data will depend on its type and the way you collected it. This section covers some basic information on how to work with the evidence you have collected with your surveys. One of the sample surveys available for download earlier in this training package included an Individual ILC Survey developed by the author whilst responsible for delivery peer programs within Families4Families (SURVEY LINK). We will now analyse data that could have collected from this survey, using simple techniques. The first questions are open-ended and includes a range of closed ended ratings questions.
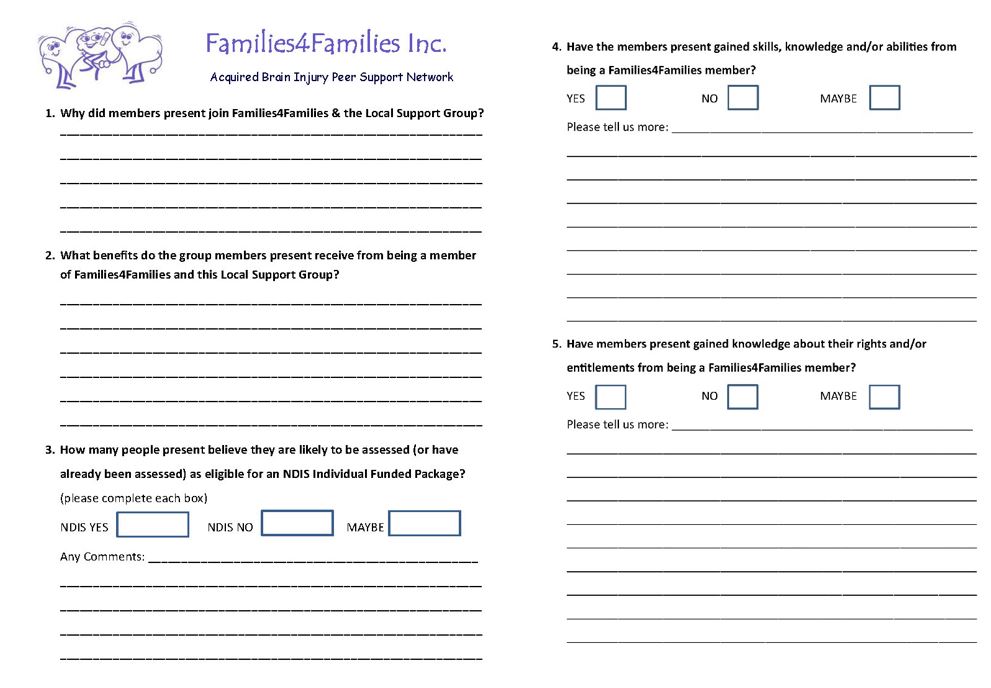
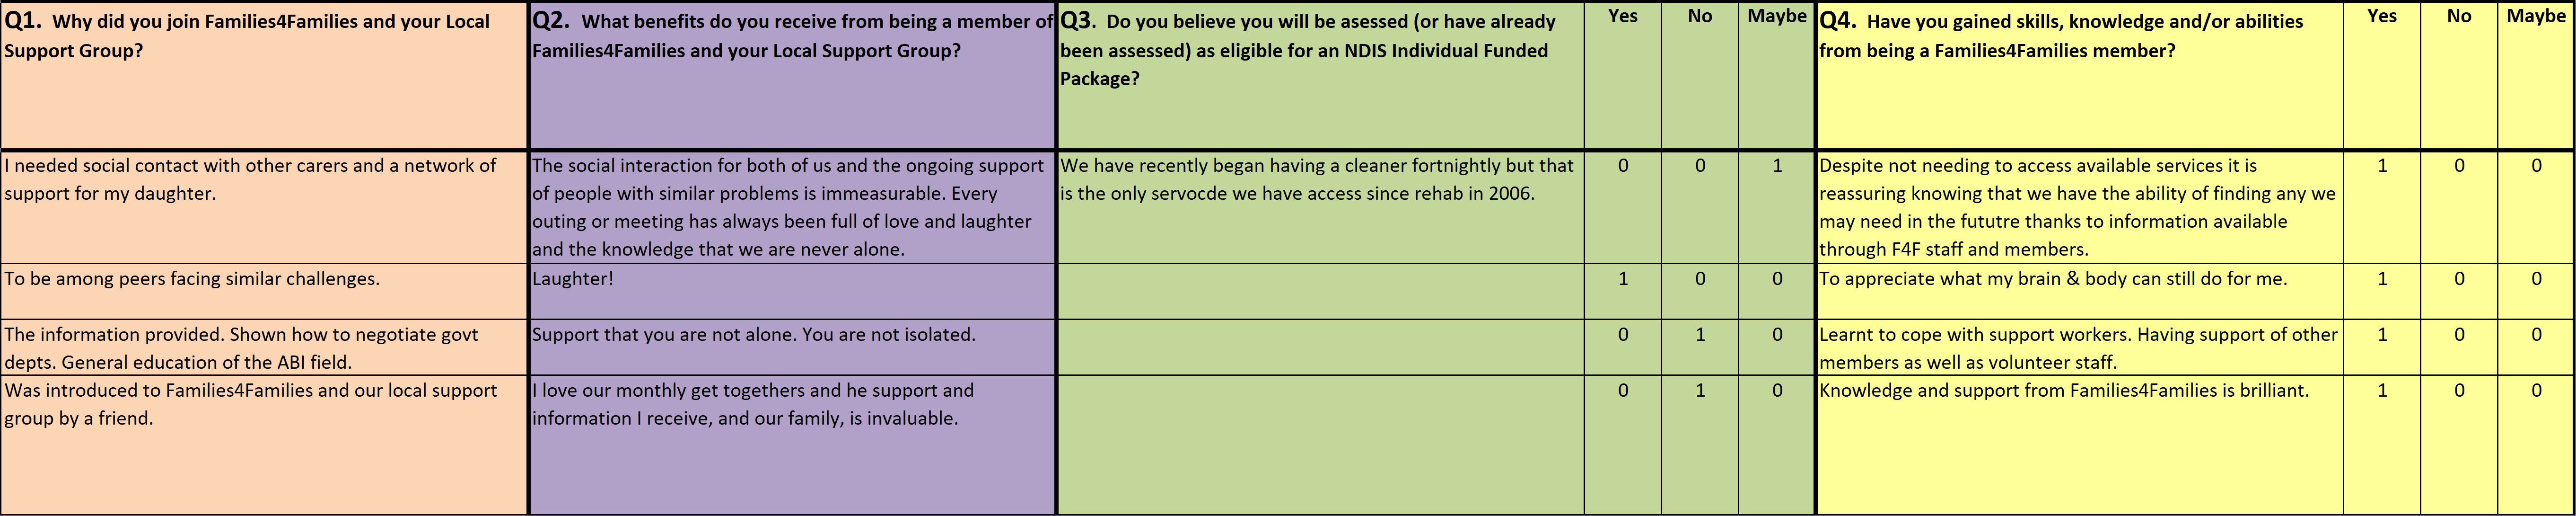
Surveys often feature an assortment of different questions: closed, open, multiple-choice and rating ones. Closed questions are usually in the format of yes/no or true/false options giving limited responses making them quick and easy to process and collate. After you have collected survey data, you will need to put it into a format ready for analysis. For close-ended data, this means converting answers to surveys into numbers. For example, if the question is ‘Do you like attending your peer support group?’ and you offer only ‘Yes’ or ‘No’ as responses, you can decide to enter all the ‘Yes’ answers as 1 and ‘No’ answers as 0. You now have data, which you can collate and use in different ways. For example, you can easily now determine the percentage of responding group members who ‘like attending their peer support group’. Once the numbers are entered into a simple spreadsheet, creating a database, you can use it to analyse the data. Typically, databases have the names of each survey question in columns along the top row, and each survey response is entered as a row. An example of this is shown below and is presented as an incomplete spreadsheet (with the questions in the top column) available here:
Open-ended questions leave the answer entirely up to the respondent and therefore provide a greater range of responses. While open questions enable the respondent to answer freely and gives greater choice of responses, the data is then more difficult to collate or group. Open-ended data can also be entered into a spreadsheet in the same format, with wider columns to make space for larger amounts of text. Alternatively, you could type survey responses into a text document (Microsoft Word, Google Docs, or Open Office) and organise them there. When you’re typing written survey responses, be sure to type the responses exactly as they are written so you can be sure you are preserving the person’s intended meaning. You can also then show them as quotations in your reports or in your other publications and materials. If you can’t read a person’s writing, you can indicate that in the data entry box or document using brackets or notes.
SELF STUDY Q6.2
Give two advantages of using a closed ended question in a survey, and two disadvantages.
Give two advantages of using an open ended question in a survey, and two disadvantages.
SELF STUDY Q6.3
What types of questions will you include in any surveys you need to develop to gather your evidence?
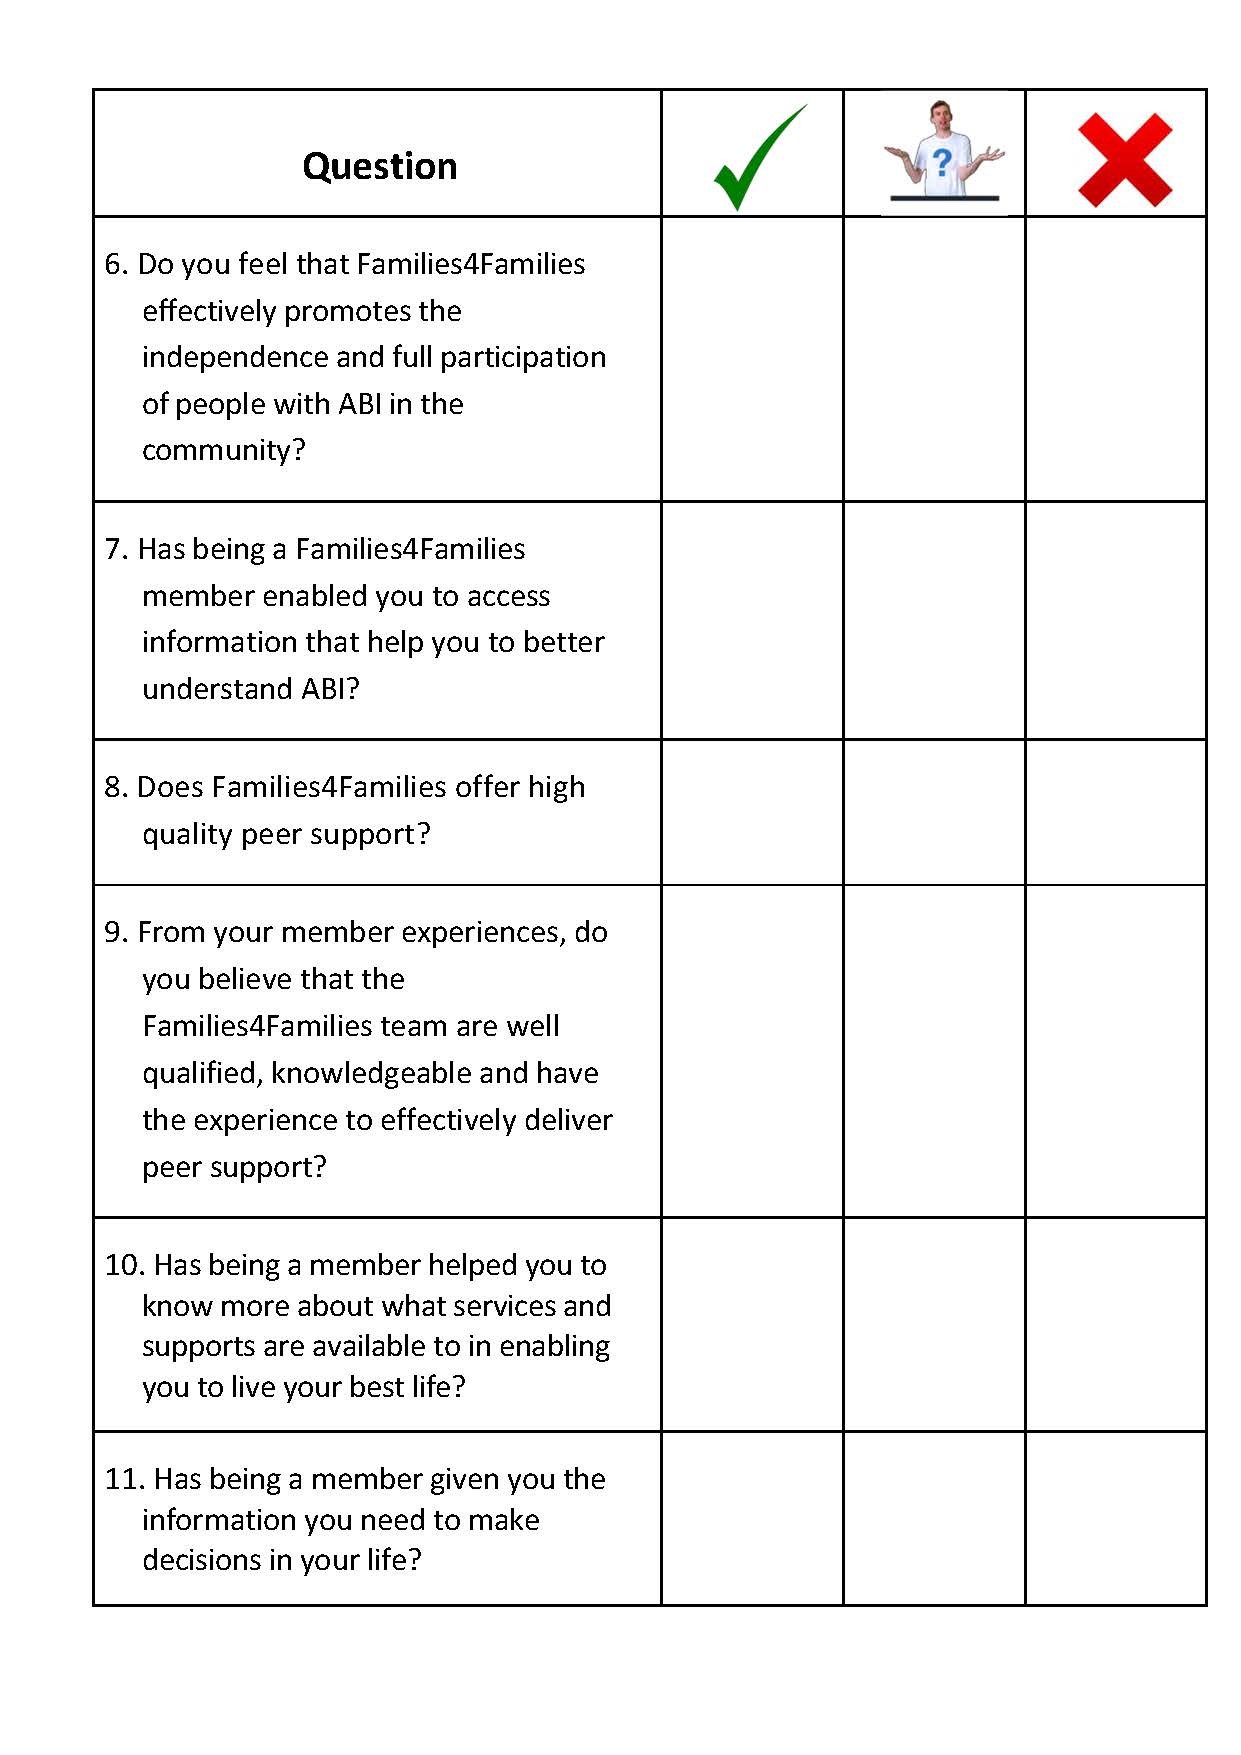
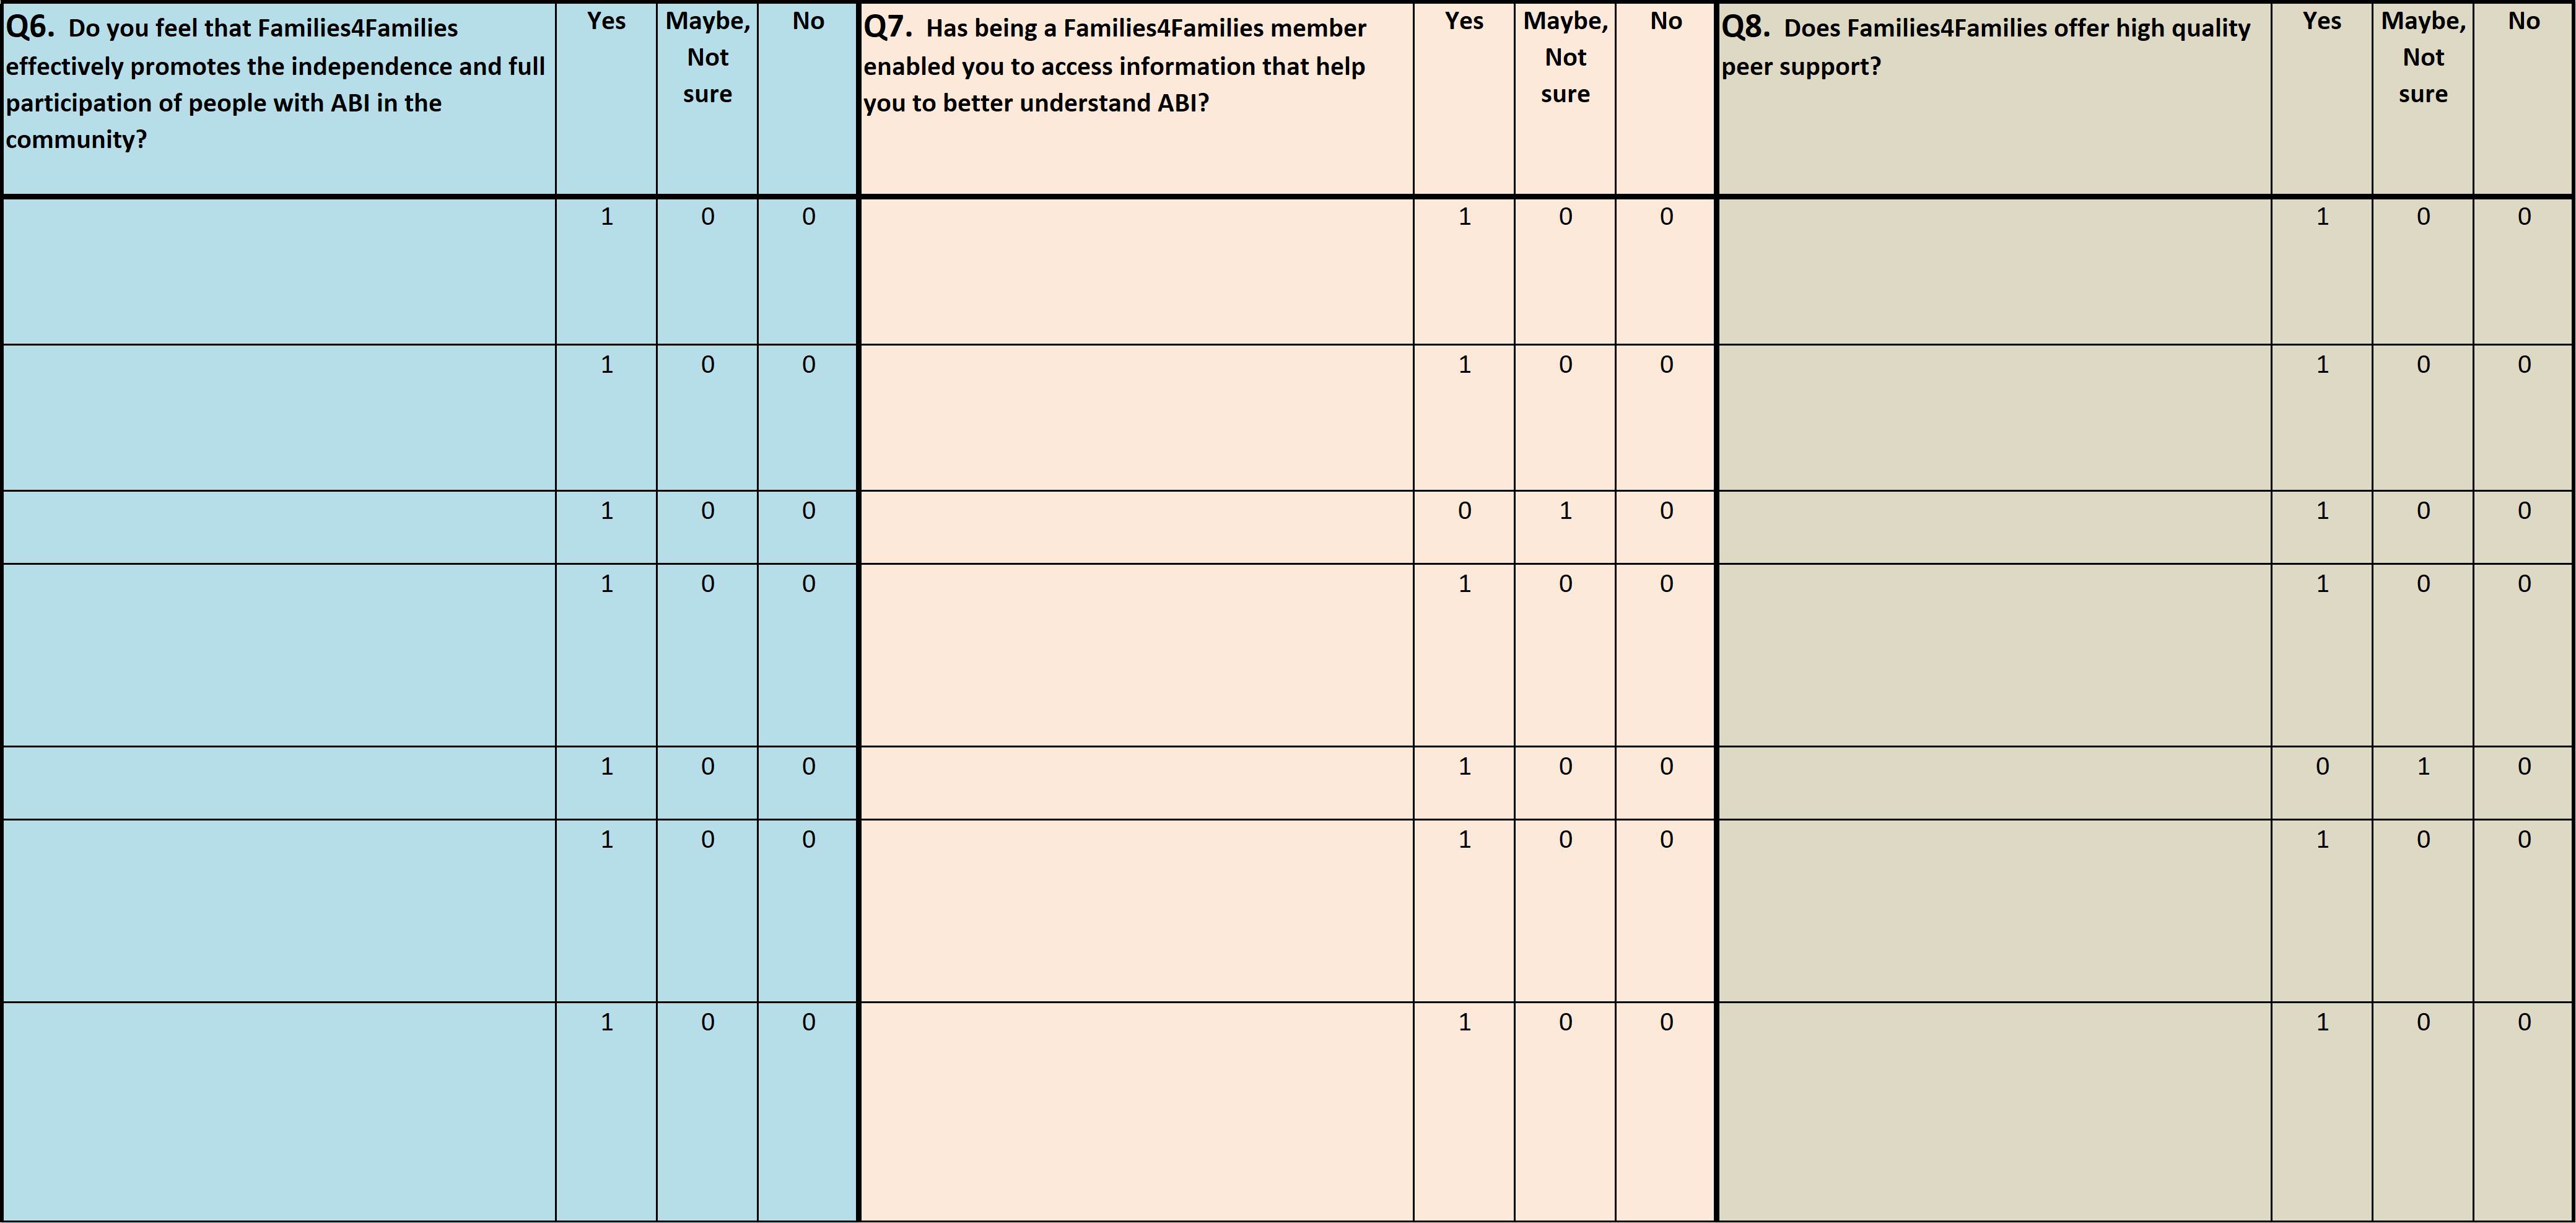
Surveys can also utilise scales to assess attitudes. Semantic scales (where responders are asked to rate subjectively something from 1 to 5) are also widely used. For example, ‘how connected do you feel with your peer group’ on a scale of 1 to 5 (when 1 is not at all connected, and 5 is extremely connected)? Most scales include this information so the respondent knows exactly how to answer each question. Scales ranging from 1 to 5 (or 1 to some other number) are commonly used and may be called ‘Likert Scales’. We may also wish to assess a scale for questions such as those shown below. In this case, we offer an alternative to only YES or NO which we can call MAYBE or UNSURE.
Individual ILC Survey developed by the author whilst responsible for delivery peer programs within Families4Families (SURVEY LINK). We will now analyse data that could have collected from this survey, using simple techniques. The first questions are open-ended and the survey also includes a range of closed ended questions.
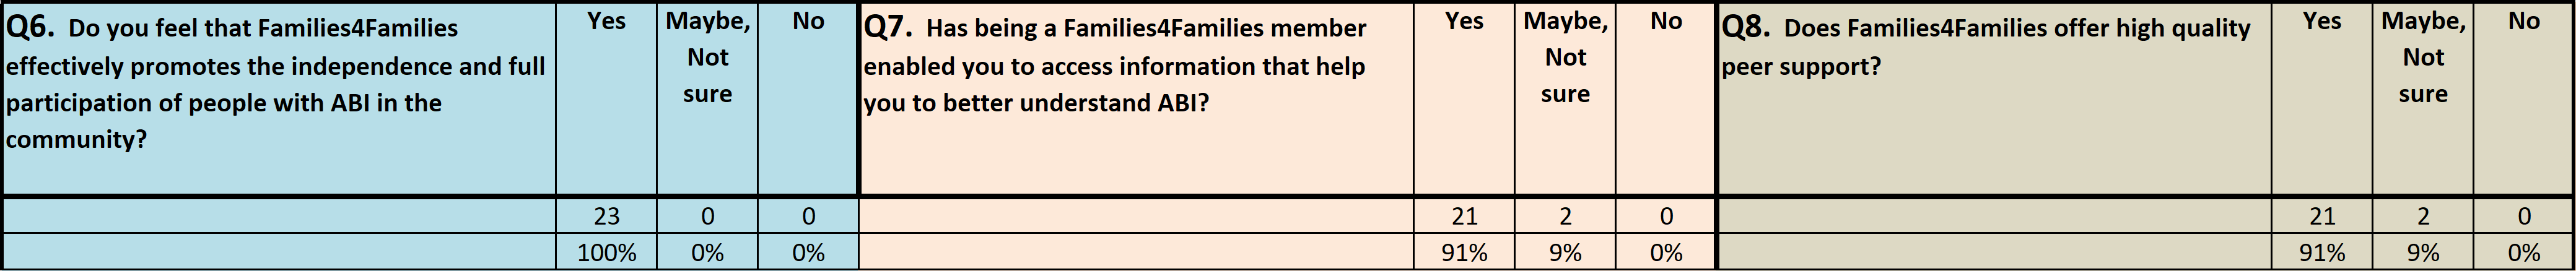
We can again code these responses into numbers in the spreadsheet. We may decide that YES can be coded as 2, MAYBE as 1 and NO as 0. As long as we use these numbers with caution as it may not be true that a yes response is the same as double the maybe response. We may instead prefer to code them in different columns, as shown below. When this survey was used within Families4Families we set up columns for each possible response and were able to then calculate response percentages. The spreadsheet used for this analysis illustrates the use of this coding option:
Multiple-choice questions can also be used. For example, we could ask respondents to indicate their favourite topic covered in the peer group, or their preferred location. Again, we can convert these answers into a number. For something like the favourite topics question, it might make sense to scale the topic selected as favourite as 1, the next 2, etc. Then we could sort according to most popular by person and across all respondents from the same group, and across all respondents. Once more, this will depend upon the objective we are trying to assess via this question within this tool.
Using this approach assumes that you have access to a computer and a spreadsheet program for your data analysis. While most peer organisations are likely to likely to use Microsoft Excel for this purpose, there are also some free programs available such as Google Sheets (see: https://www.google.com/sheets/about/) or Open Office (see: http://www.openoffice.org/).
The BetterEvaluation website has a LINK to a tool which assists in calculating basic statistics within the EXCEL package: https://www.betterevaluation.org/resources/tools/summary_statistics/calc_mean_st_dev.
In addition, it is possible to set up a large table within a word processing package and enter the data using this method. Finally, it is also possible to analyse data using simple pencil and paper. Draw up a table with a box for each answer, and either tick or write the response for each.

There are a range of online survey development options also available; perhaps you have you heard about ‘Survey Monkey’ or another similar option? Many will offer a range of sophisticated options for paid versions but also offer simple and free alternatives. There are also online resources which compare the various options available.
See for example: https://www.wordstream.com/blog/ws/2014/11/10/bestonline–survey–tools for an excellent and quick overview of the available options.
Google Forms is currently a leading option in terms of offering excellent features within its lowest cost version: unlimited surveys and respondents, survey answers and data are automatically collected in Google Spreadsheets, great design options including themes and ability to use your own logo or add images, as well as the ability to imbed surveys into both emails and websites.
Google Forms information is available on their site https://gsuite.google.com/intl/en_au/products/forms/ where it is also possible to sign up and login.
Google also offer special options available for non-profits. This means, if your peer organisation has membership with Connecting Up, you will likely receive the package at greatly reduced rates. Therefore, when developing your data collection tools, you should factor in your resources. If you have the computer skills and required internet access, you should explore the use of free online survey programs. These will provide ease of access for most respondents, ensuring a straightforward data analysis process.
Once you have your evidence within a spreadsheet, you can use the basic spreadsheet functions to analyse the data. Some surveys may gather evidence on a specific item, which gives a score. However, in most cases, you will want to, simply tally responses by participant over time or by all respondents across questions. For surveys that involve scales and sub-scales, you will be looking to create summary statistics such as the minimum, maximum, and mean (average). You can use spreadsheets to calculate summary statistics (including simple tallies and percentages as shown below, but also other statistics if required).
There are many tutorials and resources available online that provide step-by-step guidance and tools, depending on the type of spreadsheet you are using. Once you have been gathering data over time, you can also compare responses for the same responder over time to see if scores change over their group attendances. If you are using a survey software (like SurveyMonkey or Google Forms), you can also create simple summaries within the web browser. You can also download your data in a spreadsheet format and work with it yourself.
While there are clearly many options for analysing closed ended questions, we will often have an assortment of open-ended questions encompassed within program surveys. In the peer support space, open-ended questions can be very helpful for attaining greater insight compared to their closed-ended counterparts. For example, if we ask a member whether they find the topics discussed in groups helpful with Yes/No closed ended responses, we can follow up asking why. This will give us a richer understanding of the reasons motivating responses. A survey process with open-ended questions gives members and other key stakeholders, the opportunity to provide a range of feedback, ideas and information.
Open-ended responses can help the peer program team to identify new and different ways of thinking about program design decisions. For these same reasons, working with open-ended data can be challenging. One way to organise open-ended responses is to sort them into themes – or common threads across different responses. In this process, we put our efforts into finding similarities. If we can achieve this, we are then more able to draw overall conclusions from the varied comments provided. We shall explore a relatively straightforward example. Let us assume you want to know what aspects of the peer support group members find important. As such, you have included the following survey question in your member survey: “What did you like best about your peer support group?”. If you received the following ten responses:
- Getting to know Sam [another member]
- Meeting new friends
- NDIS information
- Having coffee with other members
- Morning tea is yummy
- Taking a break from being home
- Restful
- Skills I learn
- Getting out and about with group members
- The facilitator is great and I learn a lot
You might divide the responses into the following themes:
- Connecting with others (1, 2, 4, 9, 10)
- Food (4, 5)
- Rest/taking a break (6, 7, 9)
- Gaining skills/knowledge (3, 8, 10)
Note that some responses are included in multiple themes. For example, ‘Getting out and about with group members’ is included in ‘Connecting with others’ as well as ‘taking a break’. You may also need to create an ‘Other’ theme to which you place any responses that are difficult to group with others.
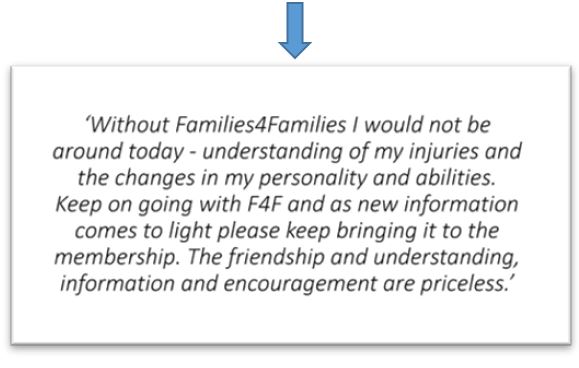
Once you have created a list of themes, you can report on the most common ones and count the responses under each to see how many times an issue or concept came up. This gives a general sense of how your group members responded to the question overall. We should also note that although counts can be useful to see how most people feel about the question posed, it might be that only one guest responded in a way, you feel is particularly important. These responses could be highlighted somehow to appropriately represent one person’s unique experience (without any identification of course), such as using a quote in a report or promotion.

The process of drawing out themes from qualitative data can be undertaken in a more formal way. There are some excellent online resources, which provide quality step-by-step guides to doing this (see for example https://www.sciencedirect.com/science/article/pii/S1877129717300606). This booklet on thematic analysis (TA) illustrates detail around this data analysis strategy that is a commonly used approach when working with qualitative evidence. In this resource, Castleberry and Nolen (2018) define thematic analysis as a method of ‘identifying, analysing, and reporting patterns (themes) within data’, which reduces data complexity enabling it to be flexible enough to dovetail with other data analysis methods. They provide an overview of the stages in qualitative data analysis: compiling, disassembling, reassembling, interpreting, and concluding.
Qualitative data analysis tools include: https://www.sciencedirect.com/science/article/pii/S1877129717300606 and Better Evaluation also has excellent resources including: https://www.betterevaluation.org/evaluation-options/thematiccoding.
It is clear that both quantitative and qualitative data can be analysed, ensuring we are best able to assess performance against our targets. For each specific objective within the four Balanced Scorecard perspectives, we can gather evidence, deciding where we are located, respective to our vision. By analysing our data effectively, we get the best possible indication of our location, positioning us well to adapt our journey if we are going slightly off track. This is obviously hugely beneficial within the peer space.
Capsule: plan for data analysis ahead including how you will use your evidence whatever type of information you have collected. Analysed data enables you to report to your peer organisation’s key stakeholders.
SELF STUDY Q6.4
Based on your planned evidence gathering (including your answers to question 6.3), will you have qualitative or quantitative data to analyse, or both?
SELF STUDY Q6.5
What broad steps will you follow to analyse this data once you have collected it?
SELF STUDY Q6.6
Why is is important to think about what you will use your data for prior to actually collecting it?